
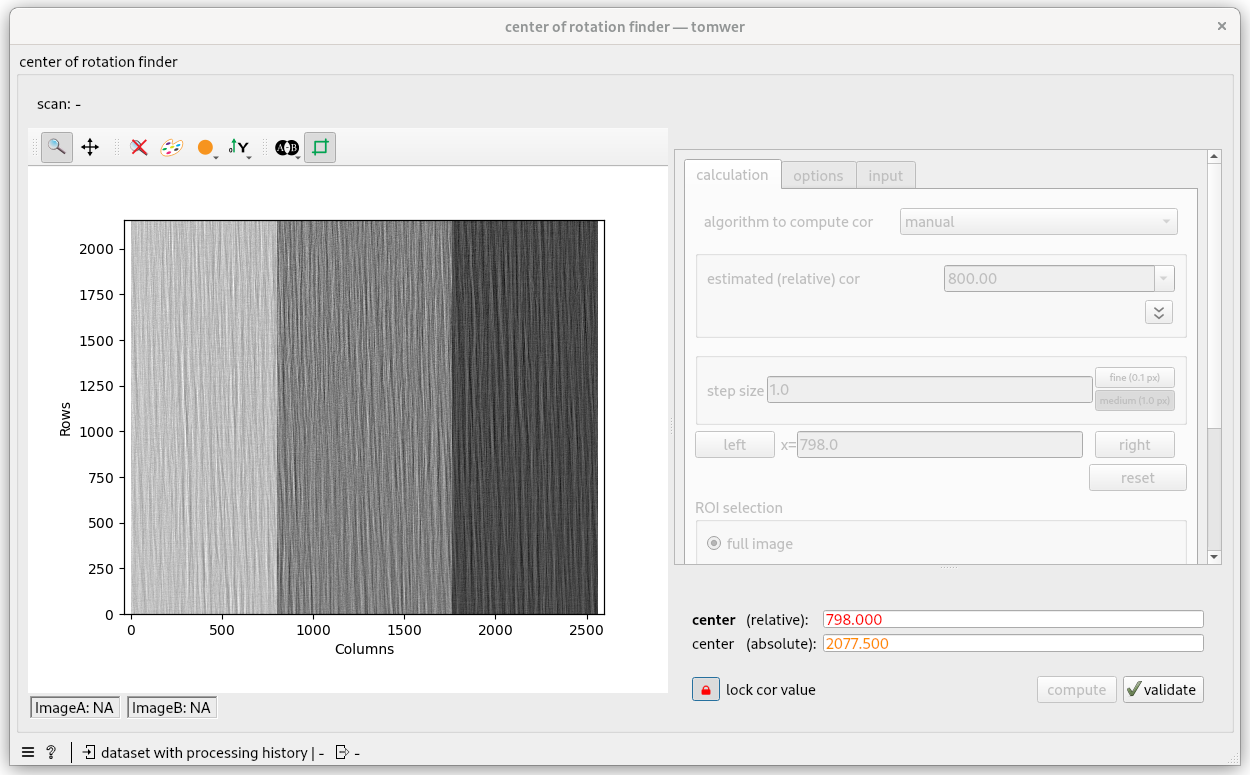
center of rotation finder#

Context#
This widget is used to compute the center of rotation.
The algorithm (or mode) is defined by the following combo box:
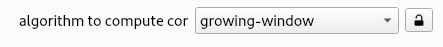
You can either find it from:
a set of algorithms (provided by nabu)
manually (from exploration)
reading from scan (aka data) metadata
Find cor from nabu algorithms#
CoR search algorithms are either:
based on a pair of projection
based on a sinogram
based on a set of projection
based on a pair of projections#
In this case we will usually take one projection at 0° and one at 180°. But other angle can be used (to be defined in the Input tab) Existing algorithms using this technic today are:
based on a sinogram#
In this case one line of each projection will be used (sinogram). This line can be defined as well in the Input tab Existing algorithms today are:
Warning
those algorithm require to have projections within a 360° range. As a consequence they are not able to process half acquisition.
based on a set of projection (aka composite)#
This is a hybrid approach that will no correlate a pair of projections but n pairs. See details
Today the only algorithm existing is ‘composite-coarse-to-fine’. ‘near’ exists but this is simply an alias to ‘composite-coarse-to-fine’ for legacy reason.
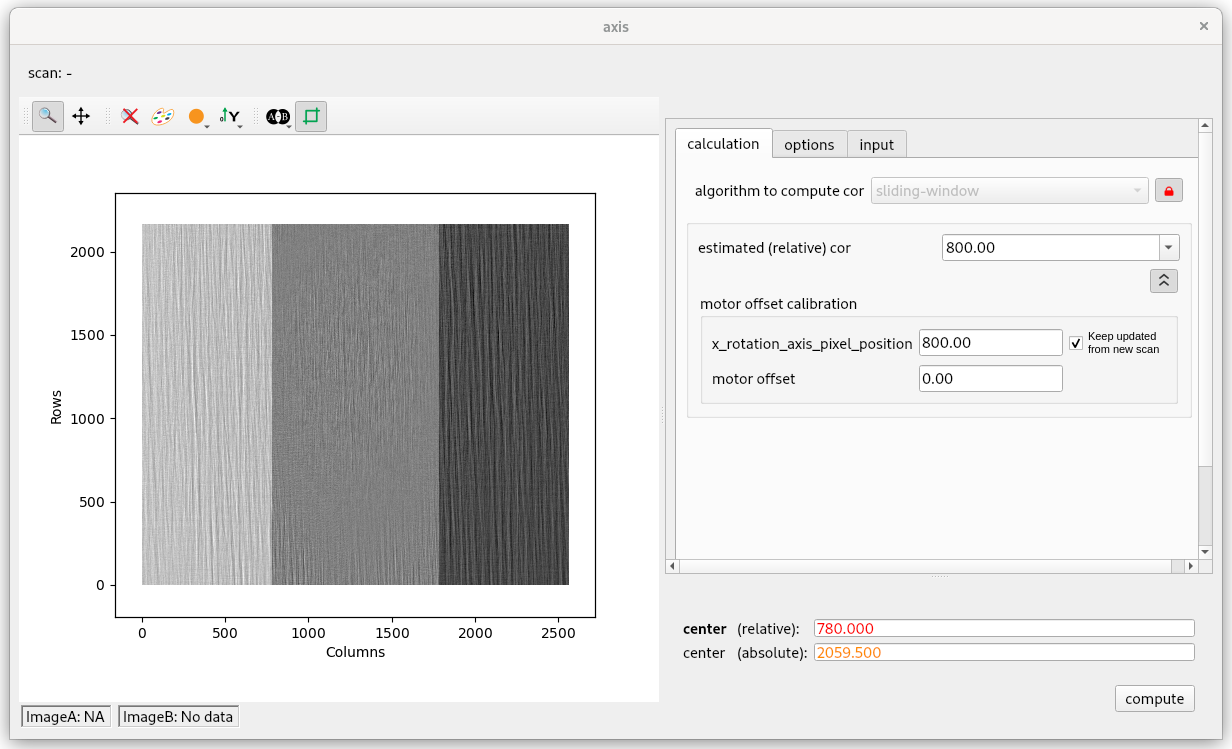
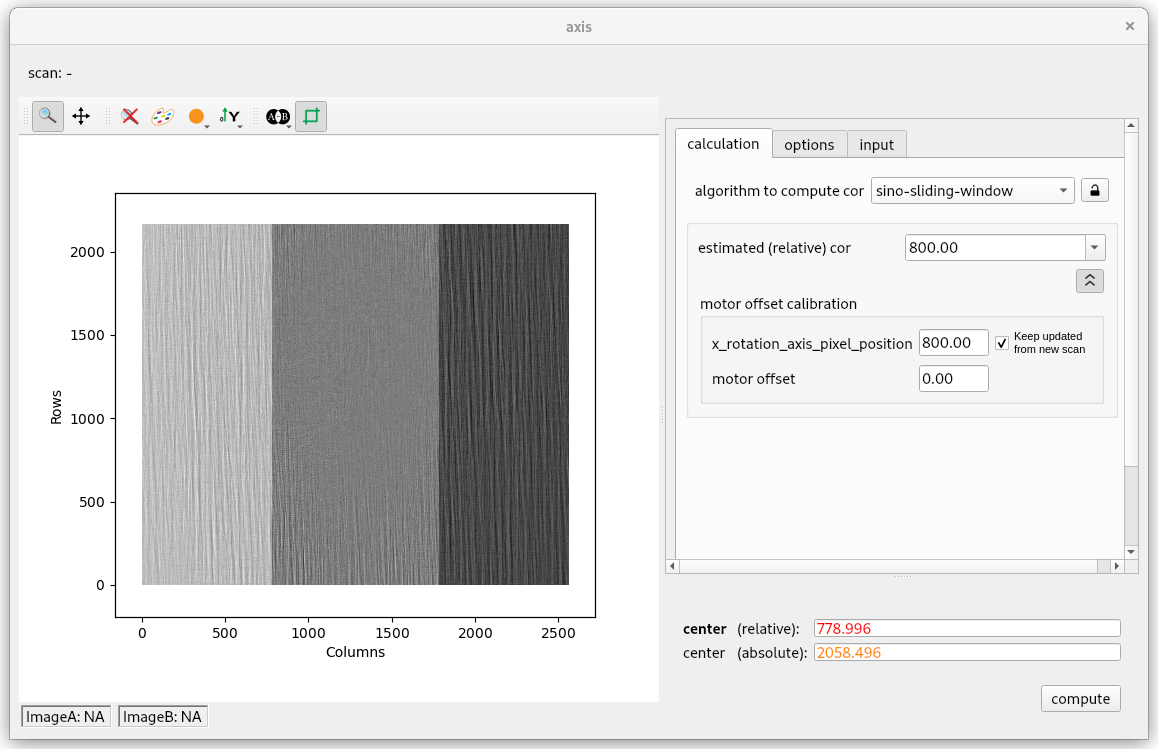
Estimated cor value#
All those algorithm can provide an hint on the center of rotation value. Either providing a side or a directly a numerical value.
Side#
Sides can be:
left : look for a CoR in the first third.
right: look for a CoR in the last third.
center: look for a CoR in the second third.
all: look for a CoR in left, right and center and select the ‘best-one’
Warning
algorithm will usually only accept a subset of side. So sometime you will not be able to select all or center for example.
Numerical value#
Now most algorithms can handle a ‘guess’ provided by the user. It must be given as a relative value (so 0 is in the ‘middle’ of the detector) Then algorithm will return a value near this guess.
numerical value update
by default and when possible the numerical value will be deduced from the ‘motor offset’ widget.
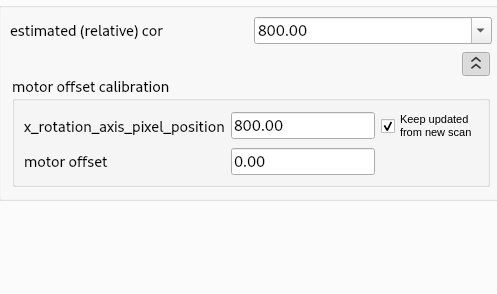
x_rotation_axis_pixel_position is the position of the center of rotation in the detector space in NXtomo. It should exist on all beamlines using recent bliss-tomo version and recent nxtomomill versions.
motor offset is the motor offset along y direction. It is usually 0 except for some beamlines like ID11.
Each time one of those field is modified it will update the numerical value of the ‘estimated cor’
When a new scan is received, if it contains x_rotation_axis_pixel_position and if keep updated from new scan is set it will update the x_rotation_axis_pixel_position and as a consequence the numerical value for the estimated cor. It would be deactivated in the use case your NXtomo contains wrong metadata and could interfere with the CoR algorithm.
Find cor manually#
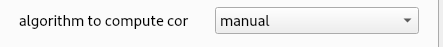
From the manual item you can find the CoR manually. The interface will display the two (opposite) projections defined in the Input tab.
Then you can move the CoR from the interface and find the best overlap.
Reading from scan (aka data) metadata#
The read ‘x_rotation_axis_pixel_position’ option will try to read the NXtomo metadata ‘x_rotation_axis_pixel_position’ and set it when exists. It can be interesting if you want to do fast reconstructions.
Automation (and lockers)#
It is possible to automate the processing:
by locking the CoR value directly to be used (locker button on the right of the found Cor - at the bottom). In this case when a new scan arrives it will take this value and move downstream.
screenshot
by locking the CoR algorithm to be used (locker button on right of the ‘sliding-window’). In this case when a new scan arrives it will trigger CoR calculation with the defined settings, when result comes, store it and then only move downstream.
screenshot
Details on the different tabs#
Calculation tab#
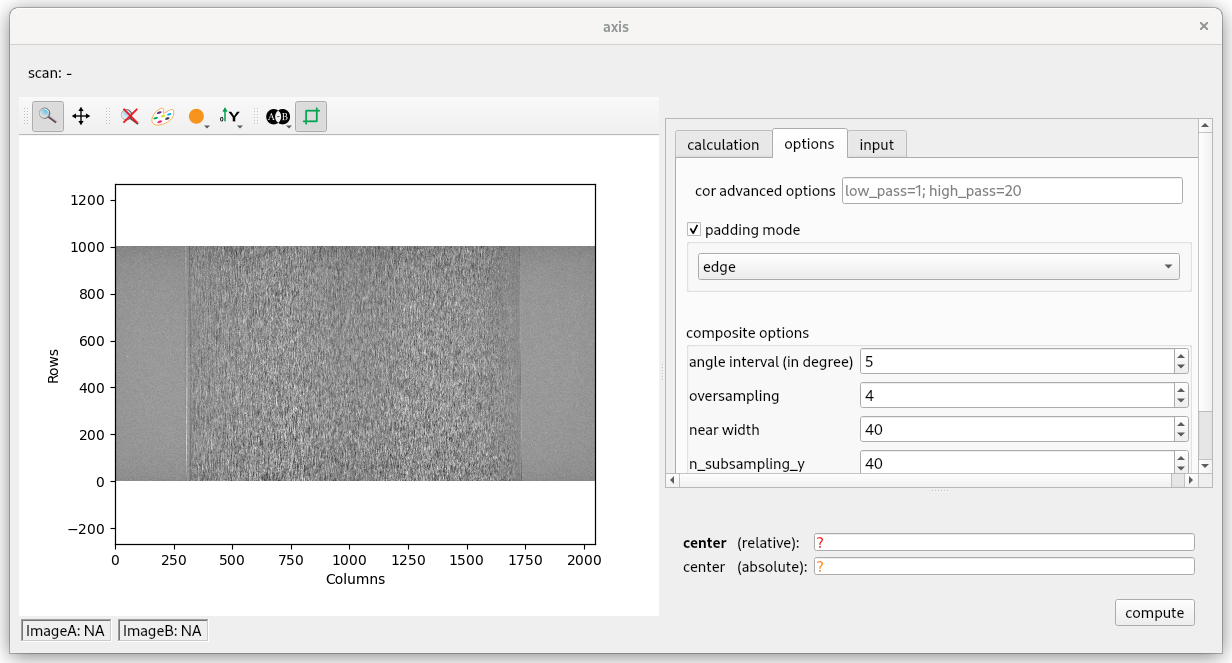
Options tab#
this widget allows users to fine tune some input of the Cor algorithm like a search width…
Input tab#
this widget allows users to define the radios or sinogram to be used for the different CoR algorithm or manual search.
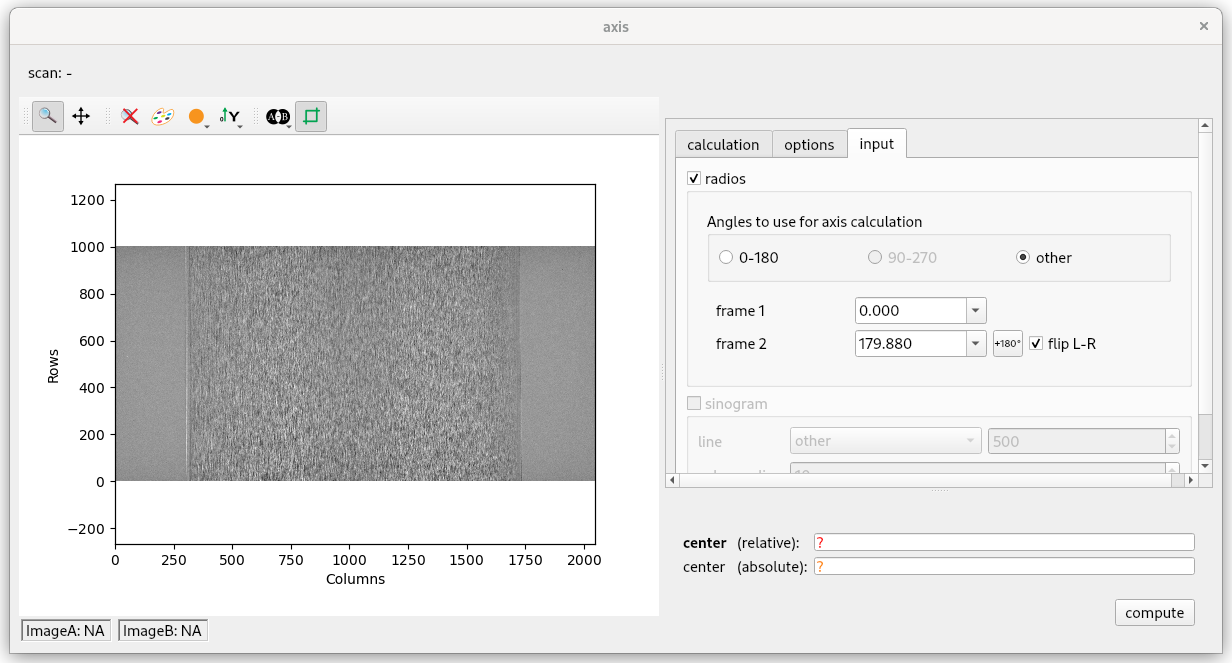
The ‘radios’ section defined the pair of projections to be used
The sinogram section defines the line to be used for sinogram-based algorithm as some possible sub-sampling. It also allow used to fine-tune the setting for ‘composite’ algorithm.
glossary#
CoR: Center of Rotation
absolute center (of rotation): CoR in \([- \frac{framewidth}{2}, \frac{framewidth}{2}]\)
relative center (of rotation): CoR in \([0, framewidth]\)
How-to videos#
More#
If this widget is not enough to find your center of rotation you can have a look at multi-cor